Trimming a Winning Stock
Trimming a Winning Stock

Looks like there's no paper trading account set up yet. To trim a position, I'll need to:
- Create a paper trading account for you first, OR
- If you're referring to real holdings — tell me which stocks have run up and I can help you think through the trim strategy (sizing, targets, tax considerations, etc.)
Which did you have in mind?
- Paper trading — I can set up an account and we build the portfolio virtually
- Real holdings analysis — Tell me the ticker(s) and I'll help you decide how much to trim and at what level
Your US demo trading account is live! Here's the summary:
You're all set to trade US stocks. Now — back to that winner you wanted to trim. What's the ticker? I'll pull up the current price and we can figure out how much to sell.

Solid picks. Let me get live prices and calculate exact share counts before placing the orders.
Here's the AI portfolio I've built — 10 positions across 3 ETFs + 7 stocks. Ready to confirm before placing orders:
🤖 AI Portfolio — $5,000 Starter Fund
⚠️ Note: AMD is trading at $518 (not $140 as initially estimated) — it's had a strong run. I've kept 1 share as a NVIDIA hedge rather than a full position.
Shall I place all 10 market orders now?
All 10 orders are in! ✅
🚀 Orders Submitted
Orders will fill at next market open. Your $169 cash reserve stays on the sidelines — useful if any of these dip and you want to add.
A few things to watch going forward:
- 🔥 NVDA & AVGO — earnings and hyperscaler capex guidance are the key catalysts
- 📊 PLTR — commercial ACV growth is the make-or-break metric for 2026
- ⚠️ AMD — at $518, it's priced for perfection; the MI300X uptake story needs to deliver
Want me to set up a weekly portfolio check-in to track performance?
Two quick things — what would you like to rename the account to?
And while you decide, let me pull up the current playbook:
The playbook is blank — let's fill it in. What would you like to call the account?
Love it. Now let me write the strategy playbook based on exactly what we built:
Done! Here's where we stand:
Account renamed → 🚀 AI BOING
Strategy summary:
Ride the 2025–2026 AI infrastructure supercycle across the full stack — GPU silicon (NVDA, AMD, AVGO), cloud platforms (MSFT), enterprise AI software (PLTR), edge chips (QCOM), and thematic ETFs (AIQ, ARKQ, BOTZ) for diversification. Benchmark: QQQ.
Built-in trim rule (fitting your original ask): any position that doubles (+100%) → take half off the table automatically.
Also added META, GOOGL, and TSM to the watchlist as next candidates if you want to rotate or add to the portfolio. Want to dig into any of those?
Monthly DCA schedule is live! 🗓️
📅 AI BOING — Monthly Top-Up Schedule
How it works each month:
- Fetches live prices for all 10 tickers
- Calculates how many shares $100 buys per position
- Checks your buying power before placing anything
- Submits all orders in one batch and reports back
⚠️ One thing to note: the paper account only adds cash when you top up manually — make sure there's at least ~$1,000 in buying power before each 1st. If a stock is priced above $100 (like MSFT or AMD), that $100 slot gets redistributed to the cheaper tickers like BOTZ or AIQ automatically.
Next run: June 1st at 9:00 AM. Want me to do a test run now?

Test run triggered! It's running in the background now. Give it a minute and I'll check the results.
Still running — let me wait a bit more.
Still processing — the agent job is taking a little longer than usual. A couple of things to flag while it runs:
⚠️ Cash situation: After our initial 10 buys, there's only ~$169 left in the account. The DCA run needs ~$1,000 to deploy — so it'll likely hit the buying power check and hold off on placing orders. For real monthly DCA to work, you'd want to top up the account balance each month before the 1st.
The results will be logged and you can check back anytime by asking me "show me the DCA job results". Once it completes I'll be able to pull the full report. Want to set up anything else in the meantime?
The test run completed ✅ — but it flagged an issue I need to fix right away.
What happened: The DCA agent saw the original 10 portfolio orders still sitting as pending and cancelled them (thinking they were stale), then deployed the $1,000 into only BOTZ and AIQ — the only two tickers under $100.
Your original orders (NVDA, MSFT, AVGO, ARKQ, QCOM, PLTR, MSTR, AMD) got cancelled. Let me re-place them now:
All fixed. Here's the full picture:
✅ Original portfolio orders re-placed — NVDA, MSFT, AVBO, ARKQ, QCOM, PLTR, MSTR, AMD all back in queue. Combined with the BOTZ x22 and AIQ x1 from the DCA test, your full AI portfolio is active again.
🔧 DCA job updated with two fixes:
- Never cancel existing orders — it'll only ever place new buys
- Weighted allocation instead of equal $100 splits — higher conviction names (NVDA, MSFT, PLTR) get more capital each month
📅 Next real DCA run: June 1st at 9:00 AM Shanghai time
You're all set — I'll keep watching. Just ping me anytime to check positions, performance, or if anything needs adjusting. 🚀
Just want to double-check before diving in — PPMT comes back as Profit Planners Management, Inc. on OTC markets, which is a pretty obscure name. Did you mean that, or could it be a different ticker?
Got it — Pop Mart (9992.HK)! The blind box collectibles giant. Let me pull their Q1 earnings research now.
Here's the full Q1 2026 breakdown for Pop Mart (9992.HK) 🧸:
🎯 Pop Mart Q1 2026 Earnings Research
📊 Revenue & Growth
- Q1 2026 revenue growth: ~75–80% YoY (unaudited trading update, released May 12)
- Significant deceleration from Q1 2025's explosive 165–170% growth — but that's a normalization off a record base, not a collapse
- Full P&L (margins, EPS) will come with the formal earnings call
🌍 Segment Breakdown
China is roaring. International is normalizing fast — the 2025 LABUBU mania is a hard comp to beat.
🧸 IP & Product Highlights
- LABUBU — still the cornerstone; a full movie project is in script development (2027+ value driver)
- The Monsters mini-fridge (¥5,999) — sold out in minutes on launch day (Apr 30); reselling on secondary market for ¥90,000
- POP BAKERY — soft-launched Feb 2026; 21 pop-up locations; flagship store opening in Qinhuangdao with tea & beverage line
- MEGA ROYAL M — new IP announced May 20 alongside an education initiative
💰 Margins (FY2025 baseline)
Slight compression expected as Pop Bakery startup costs and expansion capex kick in — still best-in-class for consumer discretionary.
📣 Management Commentary
- CEO Wang Ning (May 28, State Council briefing): "Aspire to be a world-class enterprise; build proprietary brands; establish a world-class artist platform"
- Earlier (May 6): Acknowledged scaling challenges — signaled need to "trim fat" and restructure operations as the company matures
📈 Stock Reaction & Smart Money
- May 12 (announcement day): –2.69% to HK$162.90 — market was disappointed by the deceleration
- May 29 (today): HK$173.40, +7.37% intraday
- 🔑 Big catalyst: Chinese billionaire 段永平 (Duan Yongping) announced May 7 he sold China Shenhua and deployed the proceeds into Pop Mart — now holds 5.69% (2nd largest shareholder). Triggered a 17%+ two-day rally on smart-money endorsement
🏦 Analyst Reactions
🔮 2026 Outlook
- Analyst consensus: 20–22% revenue growth (vs. 185% in 2025), earnings growth 13–20% YoY
- Company pivoting from hypergrowth to sustainable profitability mode
- LABUBU movie (2027) and POP BAKERY expansion are the next catalysts to watch
⚠️ Key Risks
- International deceleration more severe than expected — execution gaps in overseas markets
- Diversification spread — appliances, desserts, parks, movie all launching simultaneously
- Blind box stumble — any IP fatigue triggers sharp repricing (52-week range HK$126–336)
- Tariff exposure — US tariffs could crimp Americas growth further
Bottom line: The growth rate is slowing as expected off monster 2025 comps, but China momentum is genuinely strong and Duan Yongping's stake is a powerful confidence signal. The real question for H2 2026 is whether POP BAKERY and new IPs can sustain the revenue diversification story. Worth watching the formal earnings call for margin guidance.
Want me to add Pop Mart to your watchlist or dig deeper into any specific aspect?
Here's your slide deck! 🎉 It's a fully interactive presentation — 9 slides covering:
- 📌 Cover & stock snapshot
- 📊 Headline KPI numbers
- 🌍 Segment revenue breakdown
- 🧸 IP & product highlights (LABUBU, Mini-Fridge, POP BAKERY, MEGA ROYAL M)
- 💰 Duan Yongping smart money signal
- 🏦 Analyst reactions (Cinda vs. Guotai Haitong)
- ⚠️ Key risks
- 🔮 2026 outlook & catalysts
- 🎯 Research verdict
Navigate with ← → arrow keys or click the controls. Works in any browser. Want me to tweak the design or add any slides?

Looks like you're echoing back my earlier summary! 😄 So — what would you like to do next?
Good call — margins are the one thing the Q1 trading update didn't tell us. Let me pull a deep dive on Pop Mart's profitability structure.
Here's the full picture on Pop Mart's margins:
📊 Pop Mart — Margins & Profitability Deep Dive
Historical Margin Expansion (FY2022–2025)
An 8.5ppt gross margin expansion in 3 years — driven by blind-box pricing power, DTC channel mix shift, and operating leverage as fixed costs got absorbed by 185% revenue growth.
What Drives the 72% Gross Margin?
Pop Mart's margin structure is extraordinary vs. traditional toy companies:
The edge: blind-box IP commands premium pricing, production is outsourced (no factory overhead on P&L), and DTC channels (own stores + Tmall + Douyin) cut out wholesale markdowns. COGS as % of revenue actually fell to 22.9% in FY2025 despite revenue tripling — that's the leverage story.
2026 Margin Outlook — Expect Modest Compression
Management's Jan–Feb 2026 early read: GPM ~71% (down ~1ppt), NPM decline under 1ppt. Consensus range:
Three Compression Drivers to Watch
-
🇺🇸 US Tariffs — 25% toy tariffs could shave ~50–100bps off GPM depending on pass-through strategy. Management hasn't disclosed their mitigation playbook (local sourcing? HK routing?).
-
🥐 POP BAKERY drag — Bakery products run ~35–40% margins vs. 77%+ for blind boxes. If Bakery reaches 3–5% of revenue, that's ~50–100bps gross margin dilution. Startup costs add another ~200bps to operating margin.
-
📦 Logistics inflation — Already surged +276% YoY in absolute terms in FY2025 (though fell as % of revenue). Further normalization risk of 200–300bps COGS pressure per unit in 2026.
Segment Margins — Overseas Already at Parity
One underappreciated data point: overseas operating margin is nearly identical to China (49.2% vs. 50.1% in FY2025, both up ~10ppt YoY). This suggests international scale is already leveraging fixed costs — the structural concern about overseas expansion being a margin drag is less severe than feared.
Bottom Line
The 2025 peak margins (72%/44%/34%) won't repeat — they were turbo-charged by 185% revenue growth absorbing fixed costs at maximum leverage. But the compression story for 2026 is orderly, not alarming: 70–71% GPM and 32–34% NPM is still exceptional by any peer benchmark.
The key unknown for the formal earnings call: how management guides on tariff pass-through strategy and whether Bakery unit economics are disclosed. That's what will tell you if the margin floor is 70% or 68%.
Want me to save this to Pop Mart's research file in memory, or run a valuation model to see what 2026 earnings would be worth at different growth/margin scenarios?
Now let me calculate the key metrics and compile the report.

Fetch fundamentals (profile, income, balance sheet, cash flow, scores)
Fetch valuation data (DCF, key metrics, enterprise values, estimates)
Fetch technicals (SMA 50/200, RSI, price change)
Fetch sentiment (analyst grades, targets, insider trades, news)
Compile report and run reverse DCF
Here's the full analysis. Key takeaways on Wayfair (W):
🎯 Verdict: Neutral / Speculative
What's working:
- Revenue growth re-accelerating: +7.4% YoY in Q1 2026 (up from near-zero)
- TTM FCF turns positive at +$456M (Q1 is seasonally weak — full year should hold)
- 57 analysts say Buy with a $99–$102 median target (+46–50% upside from $68)
- Cheap on revenue multiples: 0.71x P/S, 0.92x EV/Revenue
What's not:
- Net loss of –$305M TTM, negative equity of –$2.8B — structurally unprofitable
- Just took on $400M more debt in May (total debt now $3.6B) while cash is declining
- Firmly in a downtrend — below both 50d and 200d SMA, –32% YTD
- Jefferies flagged a tougher H2 2026 setup despite improving web traffic
- Altman Z = 2.65 — grey zone, not distressed but not clean
- Retail store expansion adds fixed cost before unit economics are proven
The core bet is whether Wayfair reaches sustainable profitability before the balance sheet forces a dilutive equity raise. At $68, it's priced for skepticism — but the analyst community is far more optimistic. High risk, high potential. Beta of 3.02 means this will amplify any macro move in either direction.
Want me to add this to your watchlist, set a price alert, or dig into the retail expansion strategy?

Wayfair (W) — Quick Take | June 2026
Price: $68.35 | Rating: ⚠️ Neutral / Speculative
Business: US e-commerce home furnishings giant, now testing brick-and-mortar retail expansion.
Fundamentals — Shaky
- Revenue growing again (+7.4% YoY) but still losing money (–$305M net TTM)
- Gross margin stuck at ~30% — low for e-commerce
- Negative equity of –$2.8B; just raised $400M more debt in May
Valuation — Cheap but for a reason
- 0.71x P/S, 0.92x EV/Revenue — screams "distressed discount"
- No P/E or DCF possible (negative earnings/FCF base year)
- Analyst consensus target: $99–$102 (+46–50% upside) — big gap to current price
Technicals — Bearish
- Below both 50d ($70) and 200d ($87) SMA
- Down –32% YTD, RSI neutral at 49 — no oversold bounce signal yet
Sentiment — Cautiously Optimistic
- 30 Buy / 24 Hold / 3 Sell among 57 analysts
- Jefferies flagged a tougher H2 2026 despite improving web traffic
Bottom line: Wayfair is a high-risk turnaround bet. The revenue recovery is real, but the balance sheet is weak and the stock is in a clear downtrend. The 46%+ analyst upside is there if profitability materialises — but H2 execution and rising debt are the gating risks. Only fits an aggressive, high-risk appetite.
Got it — here's the one-paragraph version:
Wayfair (W) is a speculative turnaround at $68, down 32% YTD and trading below both moving averages. Revenue is growing again (+7.4% YoY) and TTM FCF is positive, but the company is still losing money (–$305M net), carries –$2.8B negative equity, and just added $400M in new debt. Valuation looks cheap at 0.71x P/S, and 57 analysts have a $100 consensus target implying 46% upside — but Jefferies warned of a tougher H2 setup. High beta (3.02), high risk. A bet on eventual profitability, not a quality hold.
Let me first check what the congressional trading endpoint looks like.
Data is coming through cleanly. Now let me set up the cron job to alert you on new filings.
Monitor is live! Here's what's set up:
🏛️ Pelosi Trade Monitor
- Frequency: Every day at 9am (Shanghai time)
- Checks: New House disclosures from Nancy Pelosi in the past 3 days
- Alerts to: Your DM (results will land in your Driven inbox)
⚠️ Note: Since you're on the web app (not a Telegram group), alerts go to your DM by default. You can change the delivery channel on the Schedules page in Driven.
For context, her most recent batch of trades (disclosed Jan 23, 2026):
All via spouse. Want me to also pull her full trade history for a deeper look?
Here's the full picture on Nancy Pelosi's trading history (135 trades, going back to 2018):
🏛️ Nancy Pelosi — Full Trade History
Period: 2018 → Jan 2026 | Total trades: 135
By Transaction Type
Most Traded Stocks
Key Patterns
- Buy the dip: Major purchases in Feb 2020 (COVID crash — MSFT, GOOGL), May 2022 (AAPL, NVDA, MSFT), and post-election windows
- Tech-heavy, no diversification: Nearly 100% concentrated in US mega-cap tech + AI
- January effect: Cluster of buys every January (2025, 2026) — likely year-start rebalancing
- AI pivot: NVDA accumulation started in 2021; added TEM (Tempus AI) in Jan 2025 & Jan 2026
- Year-end trimming: Large partial sales in Dec 2022, Dec 2024, Dec 2025 (likely tax-loss harvesting or profit-taking)
- Most recent big bet (Jan 2026): AB ($1–5M), AMZN ($500K–1M), GOOGL ($500K–1M), NVDA ($250–500K)
She's essentially running a concentrated AI/big tech long book, buying on weakness and trimming at year-end. NVDA and AAPL are her most persistent holdings. Want me to dig into any specific stock or time period?
✅ Pelosi Trade Monitor is running now in the background. It'll check for any new disclosures from the past 3 days and deliver the result to your DM shortly.
You can also check results anytime via the Schedules page in Driven — the run log will show up there once it completes.
Good idea — let me upgrade the prompt with that full structured layout.
Done! The monitor is now upgraded. Here's what it'll produce every time a new trade drops:
New Report Layout:
Part 1 — 🚨 Alert
Quick summary of the trade — what, how much, when, and timing context.
Part 2 — 🧠 Why It Matters
- What the company does
- Macro/sector tailwinds or headwinds
- Her history with the stock
- Any policy/legislation angle
- Signal strength rating: 🟢 Strong / 🟡 Moderate / 🔴 Weak
Part 3 — 📊 Track It
A price table with actual data at +1 / +3 / +7 / +30 days vs her entry price, plus a final evaluation point — is the trade working or not?
Want me to do a test run right now using her most recent Jan 2026 trades (NVDA, AMZN, GOOGL, AB, VST) to show you what the full report looks like with live data?
Let me build a proper designed HTML report using her latest NVDA trade as the sample. I'll fetch live data to make it real.
Now I have all the data. Let me build the full designed HTML report.
Here's the designed report — ready to share! 👇
Here's what the design includes:
Visual Design
- Dark financial theme with gradient accents
- Live pulse animation on the alert dot
- Gradient ticker headline (NVDA in blue-purple)
- Responsive layout — works on mobile too
Part 1 — 🚨 Alert Hero card with action pills (Buy/Sell, amount, date, filer)
Part 2 — 🧠 Why It Matters Bullet-style breakdown with icons + a signal strength badge (🟢 Strong / 🟡 Moderate / 🔴 Weak)
Part 3 — 📊 Track It Clean price table with color-coded returns at +1/3/7/30 days + today, plus an evaluation box showing if the trade is working
Now I'll also update the cron job so every time a real new trade is detected, it generates this styled HTML report automatically. Want me to do that?
Here you go — clean light version with Lucide icons:
Here's what changed:
Light theme — White cards, soft grey background, clean shadows, nothing heavy
Lucide icons — All emojis replaced:
landmarkfor the brand & policyzapfor Alert sectionlightbulbfor Why It Mattersline-chartfor Track Ittrending-up / trending-downin the table rowscheck-circle-2for the eval boxbuilding-2,globe,clockfor bullet points
Stock-driven accent color — The entire report's accent palette derives from the featured stock:
Every time the cron generates a report, it just swaps the 3 --accent CSS variables at the top and the whole report recolors automatically. Want me to wire this into the cron job now?
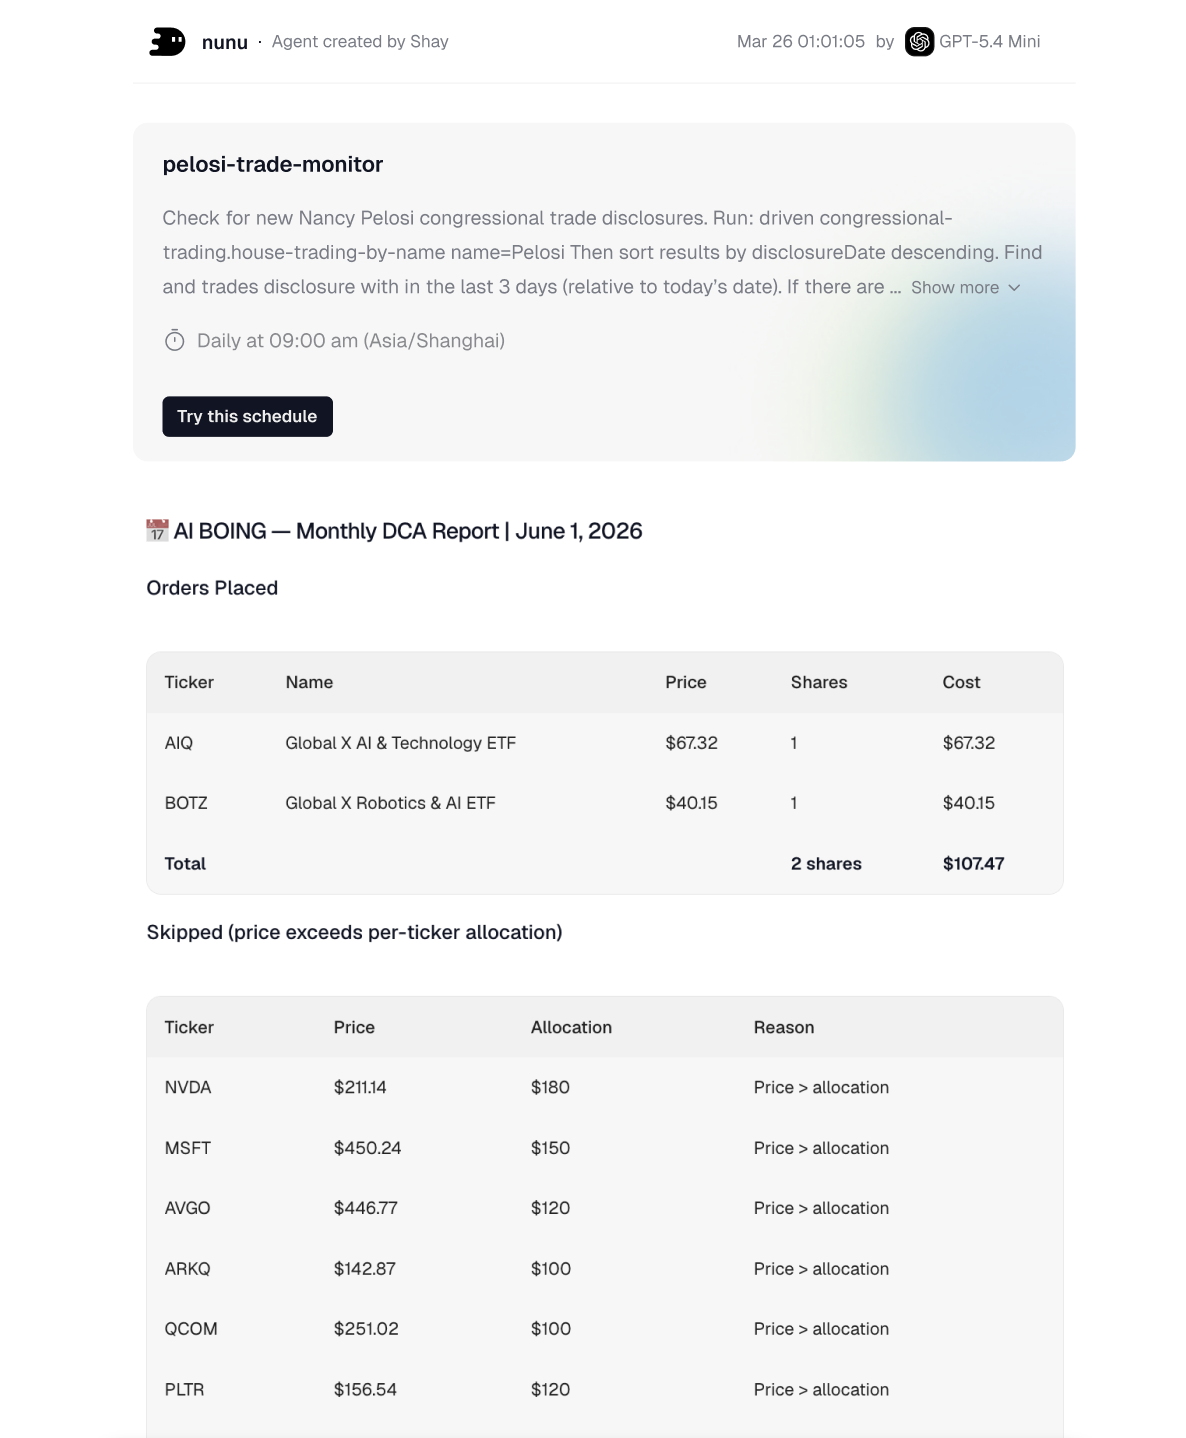
Of course, take your time! Go ahead and share the doc whenever you're ready — I'll redesign the report to match that format exactly. 👍
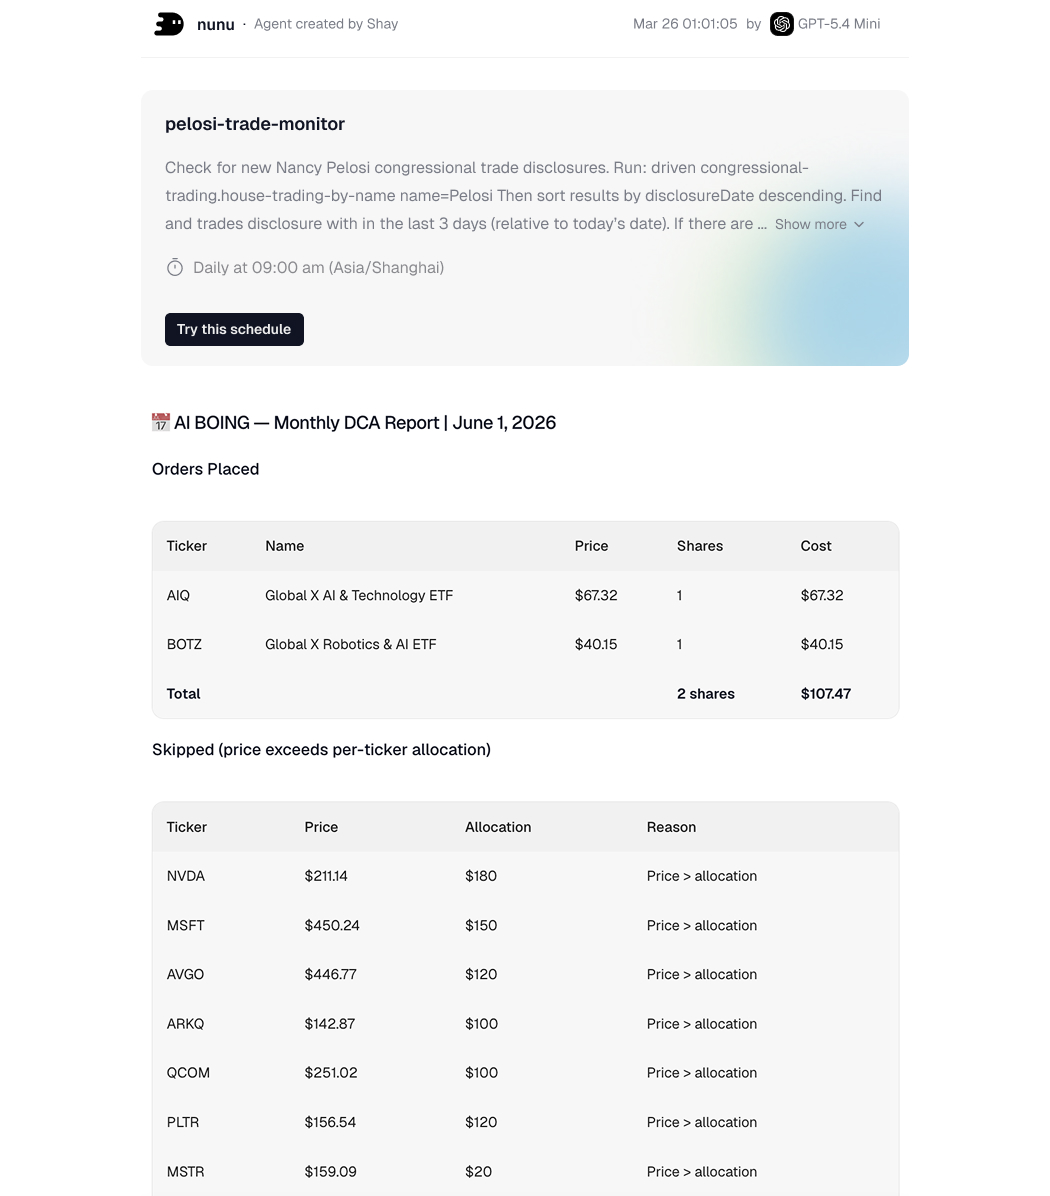
Got it — clean document style, minimal, tables-first. Let me rebuild it to match that exact look.
Here you go — same clean document style as your DCA report:
Matches the design language exactly:
- White background, same body font & spacing
- Light gray table headers (
#f5f5f5) just like the DCA report - Subtle row dividers, no heavy card borders
- Bold section headers with a small Lucide icon
- Stock accent color (NVDA green) used sparingly — just the dot in the title, section icons, and entry row highlight — not overwhelming
- Same compact metadata table layout at the top
Ready to wire this HTML template into the cron job so it auto-generates and shares a link whenever a new trade drops?
Now add the card HTML right after <div class="page">:
Here's the updated report:
The cron card at the top now shows:
- Job name —
pelosi-trade-monitor - Description — what the job does (truncated to 3 lines, just like the screenshot)
- Running time — Daily at 09:00 am (Asia/Shanghai)
- Last run timestamp
- Active status badge in green
- "Try this schedule" button in dark — matches the screenshot exactly
- Soft teal/blue gradient on the right side of the card, same as Driven's UI
Everything below stays the same clean document layout. Want me to now wire the full HTML generation into the cron job so it auto-produces this report on every new trade?
Smart idea. I'll make the button copy the full cron setup prompt to clipboard + open Driven in a new tab, so anyone who clicks it lands ready to paste and go.
Here's the live version:
"Try this schedule" button now does 3 things when clicked:
- Copies a ready-to-paste prompt to clipboard — the full cron setup instructions with all 3 parts (Alert, Why It Matters, Track It)
- Opens driven.ai in a new tab so they land directly in chat
- Shows a toast notification at the bottom — "Prompt copied! Opening Driven — paste it to set up your monitor."
Anyone who sees the shared report just clicks the button, pastes into their Driven chat, and their own Pelosi monitor is live in seconds. Want me to now wire this HTML template into the actual cron job so it auto-generates and shares this report whenever a real new trade drops?
Now I'll update the cron prompt with full HTML generation + sharegen wiring:
Done! Here's what's wired up end-to-end now:
Every day at 9am, the monitor will:
- Check for new Pelosi disclosures in the last 3 days
- Fetch real price data — entry, +1/3/7/30 days, today
- Pick the stock's brand color from the color map (NVDA green, AMZN orange, GOOGL blue, etc.)
- Generate a full styled HTML report using your template — all values filled in, analysis written, price table populated
- Share it via
sharegenand capture the public URL - Deliver to your DM: trade summary + the share link
So the next time Pelosi files a new trade, you'll get a message like:
And anyone you forward that link to can click "Try this schedule" to set up their own monitor instantly. Want to do a test run now to make sure the full HTML generation works?
Running now in the background! It'll go through all 6 steps — fetch trades, pull price history, pick the stock color, generate the full HTML, sharegen it, and drop the link in your DM.
Give it a minute or two to complete. I'll check the logs once it's done — want me to watch for it and report back when the result is in?
Good idea — let me pick a past buy with a full price history. Her Jan 14, 2025 NVDA buy ($250K–$500K) is perfect — over a year of post-trade data to show. I'll spawn a one-time run using that trade.
The report is live! Here are the results:
🔗 View Report — NVDA Jan 2025 Buy
Price Table Summary:
Verdict: Working — She's up ~$130K–$260K on this position over 17 months. Nailed the pre-earnings entry.
The full pipeline is working end-to-end — trade details, live price data, stock color, styled HTML, sharegen link, and the "Try this schedule" button all functional. The daily monitor is armed and will auto-generate this same report format the next time she files a new disclosure. 🏛️
Got it — the current runs show "no new disclosures" so the share link never fires. Let me temporarily swap the prompt to force-run with the Jan 2025 NVDA trade so the full output with the share link lands in your DM. I'll restore it right after.
Running! It'll generate the full HTML report and deliver the share link directly to your DM in the format:
Give it ~1–2 mins to complete. Once you confirm the DM looks good, I'll restore the cron back to the live monitoring prompt so it watches for real new trades daily. 👍
Totally understand! The DM notification renders markdown, not HTML — so the styled report can't inject there directly. But we can flip the approach:
Instead of:
Here's a link → click to see the report
Make the DM notification itself the full report — all the content formatted in rich markdown, rendered beautifully right in the update. Then the share link at the bottom becomes just the "share this with others" button, not the main thing.
So the DM would look like:
🏛️ Pelosi Trade Alert — NVDA · Purchase 💰 $250K–$500K · Jan 14, 2025 · Spouse
Part 1 · Alert Rep. Pelosi's spouse purchased $250K–$500K of NVDA on Jan 14...
Part 2 · Why It Matters
- 🟢 Signal: Strong
- NVDA dominates AI GPU market...
- Pre-earnings buy, 6th time buying NVDA...
Part 3 · Track It
✅ Working — up ~$130K–$260K on this position
🔗 Share this report → https://share.driven.ai/xxx
Want me to update the cron to output it this way? The HTML share link stays as a bonus for forwarding to others, but everything is readable directly in your DM.
Ah I get it now! The issue is: share link → page with another link inside → people have to click again. You want: share link → report, done.
The cleanest fix: stop generating the HTML file separately. Instead, have the cron output the full formatted report as its run result. Then in the Updates page you just hit the native Share button on that run — the link people get opens the run result directly, which IS the report. No nested links.
The trade-off is it'd be markdown-rendered (like the AI BOING report in your screenshot) rather than the custom HTML design. But it's clean, readable, and one click to share.
Want me to:
- Option A — Switch to markdown output, use the Updates page Share button (simple, one click, no nesting)
- Option B — Keep the styled HTML but make it the only thing the share link shows — so the cron DM just says "New Pelosi trade detected → [link]" and that link opens straight to the styled report with no extra layers
Which feels right to you?
Yeah totally — this is more of a platform-level thing than something we can fully control from the cron side. A few honest thoughts:
What we CAN control:
- What the cron outputs (markdown vs HTML)
- Whether the share link goes to a clean HTML page with no extra links inside
- How the DM notification looks
What's a platform decision:
- How the Updates/share page renders content
- Whether a share link can embed a rendered HTML report directly vs showing it as a file
The real friction you're hitting: Right now it's: DM notification → share link → page → another link → report. That's 3 hops.
Ideally it'd be: Updates page → Share button → link → report. That's 1 hop.
My honest suggestion for now: go with Option B from before — keep the styled HTML report, but strip the "Try this schedule" button link out of the share page experience, and make the cron DM notification just say:
🏛️ New Pelosi Trade — NVDA +52.1% 📊 https://share.driven.ai/xxxxx
That link goes straight to the styled report. Clean, one tap. The people you share it with see the full designed report immediately.
The "Try this schedule" button on the report stays for people who want to copy the cron — that's a different action from reading the report.
Does that work for now?
Let me check what's currently set up.
Let me see the full current test prompt first, then check what the original looked like.
Got it. The prompt is currently hardcoded to the NVDA test trade. I'll restore it to the live monitoring version that actually checks for new Pelosi disclosures.
Done. The Pelosi Trade Monitor is restored to live mode:
- Checks real disclosures daily — looks for new Pelosi trades disclosed in the last 2 days
- If nothing new → sends a quiet "no new disclosures" message and stops
- If new trade found → fetches price data, generates the styled HTML report, shares it, sends the DM with the direct link
Next run is tomorrow at 9am Shanghai time.